Neural Networks
Learn about neural networks, the backbone of many popular algorithms today, such as ChatGPT, Stable-Diffusion, and many others
Machine Learning University (MLU)
is an education initiative from Amazon designed to teach machine
learning theory and practical application.
As part of that goal,
MLU-Explain exists to teach important
machine learning concepts through visual essays in a fun,
informative, and accessible manner.
Explore Published Articles...
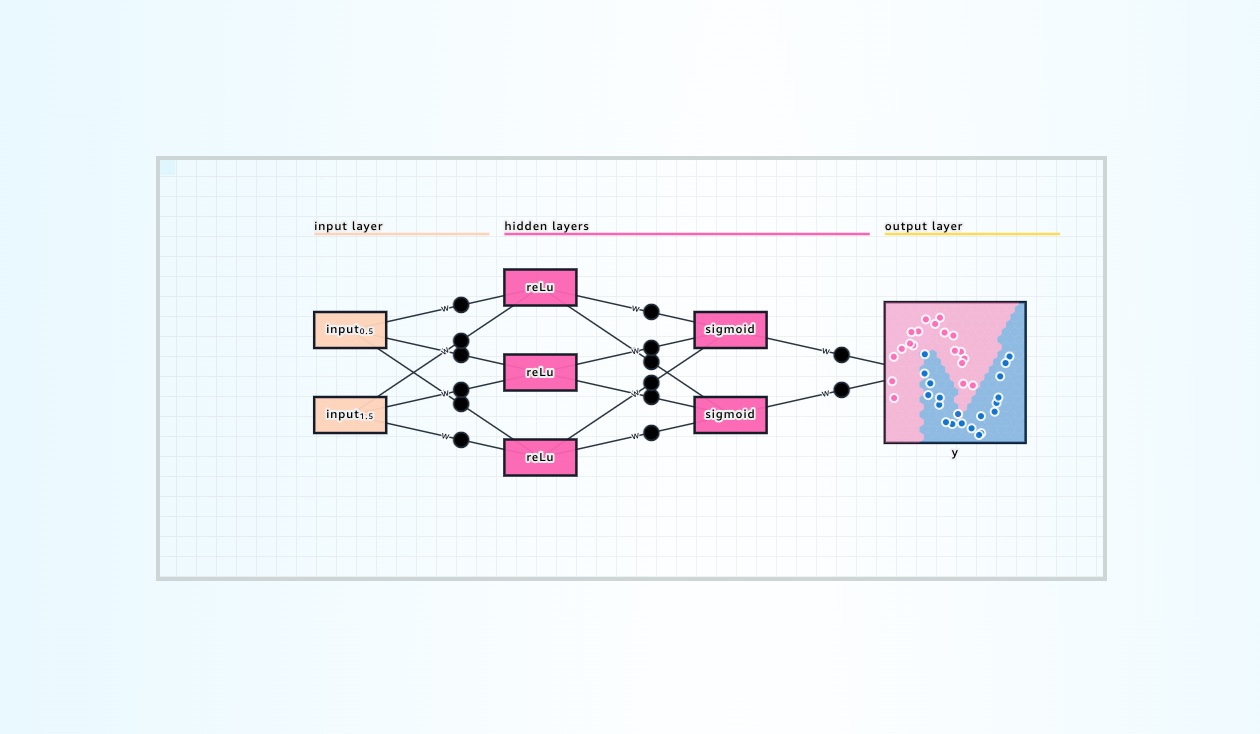
Learn about neural networks, the backbone of many popular algorithms today, such as ChatGPT, Stable-Diffusion, and many others
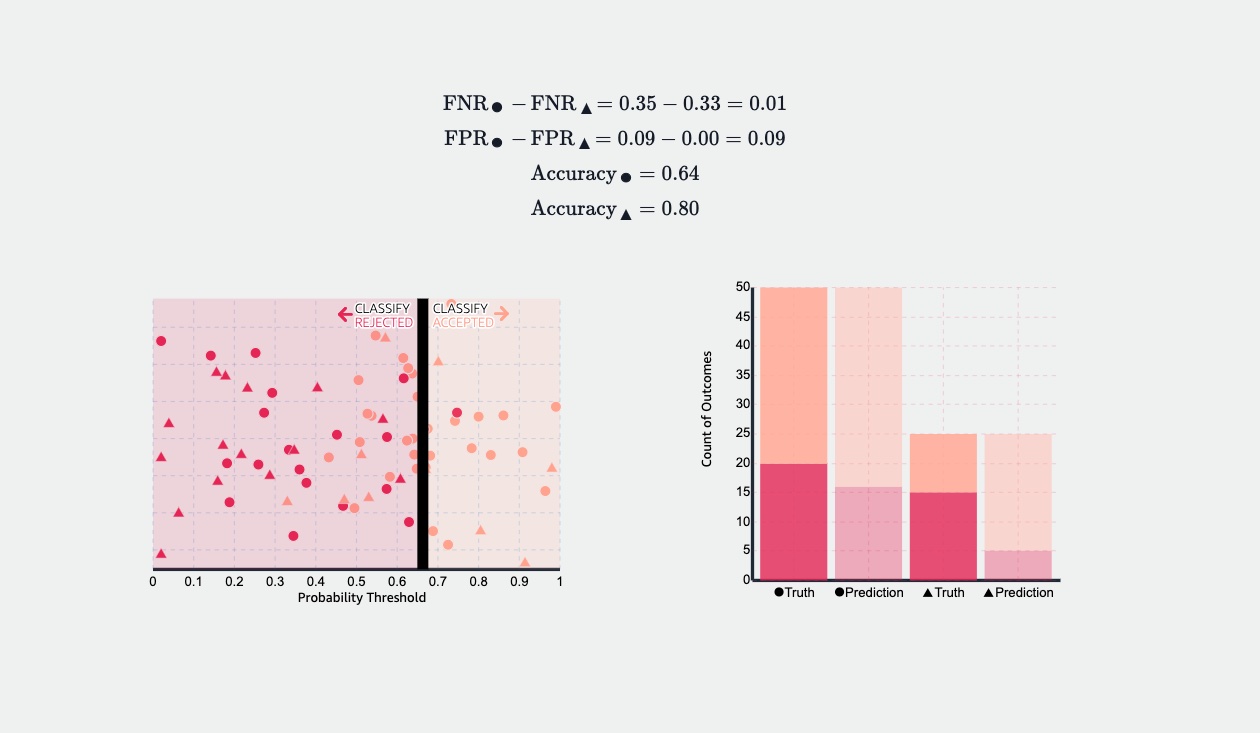
Explore equality of odds, a metric used to quantify unfairness and remove bias from machine learning models.
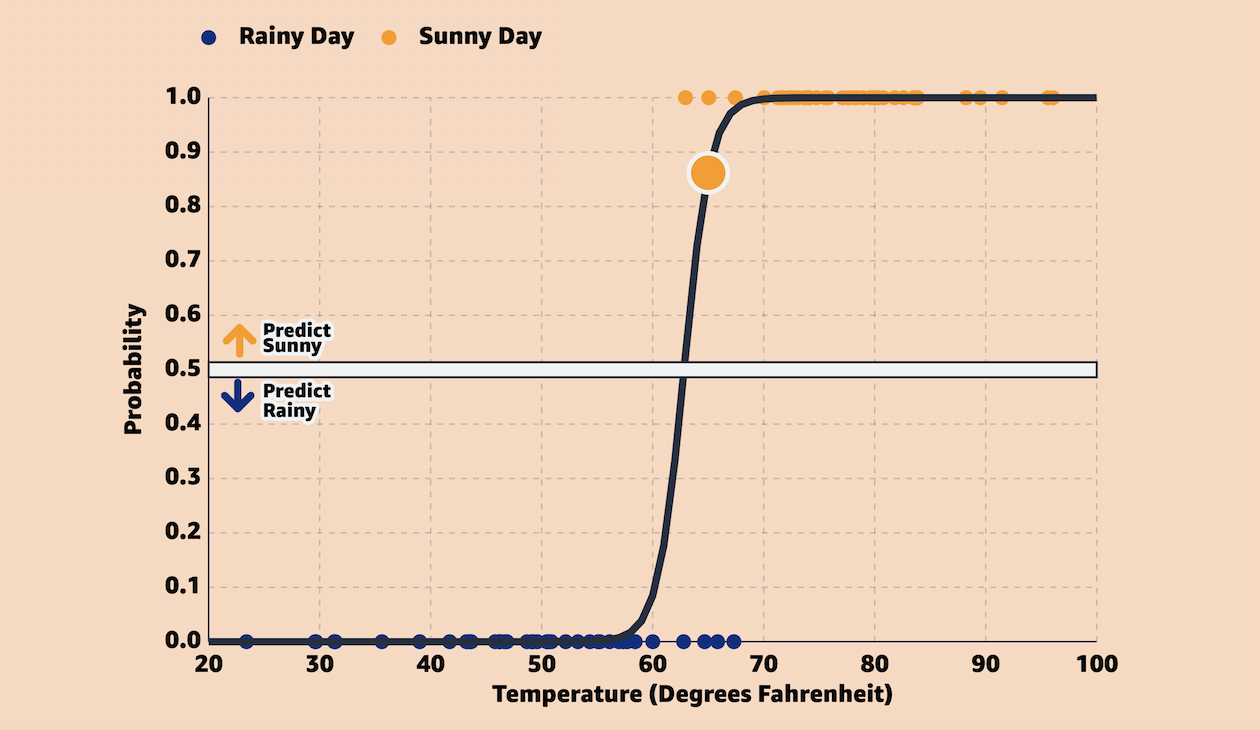
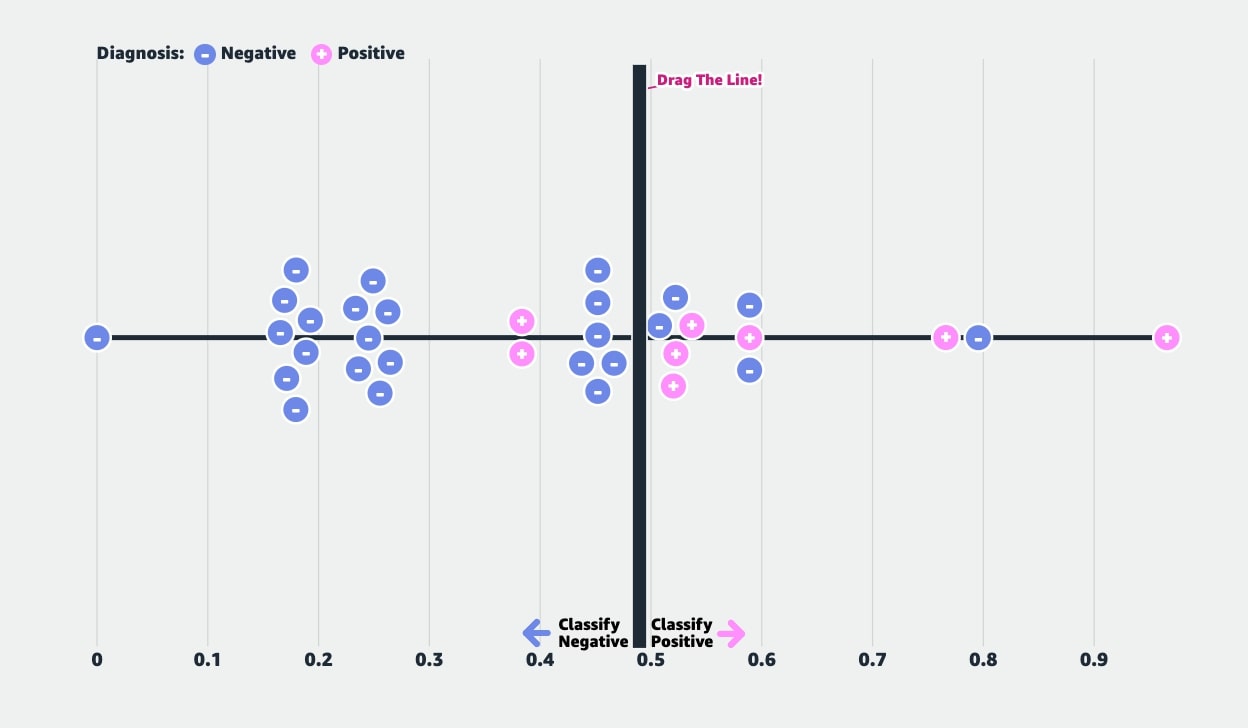
Learn how logistic regression can be used for binary classification in machine learning through an interactive example.
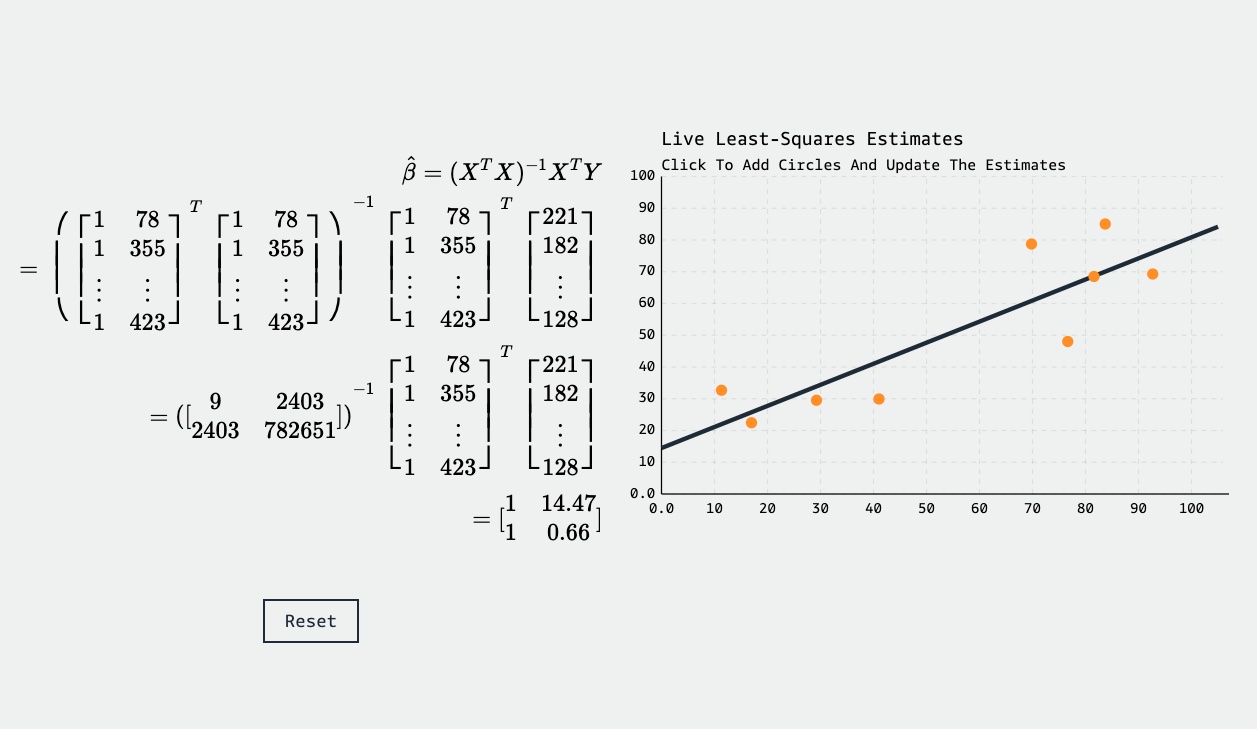
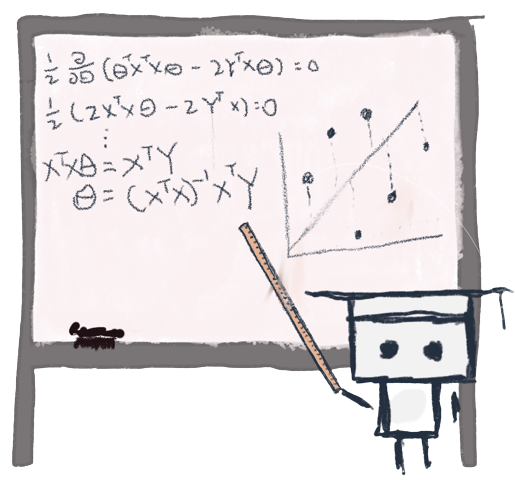
Interactively learn about linear regression models as they're commonly used in the context of machine learning.
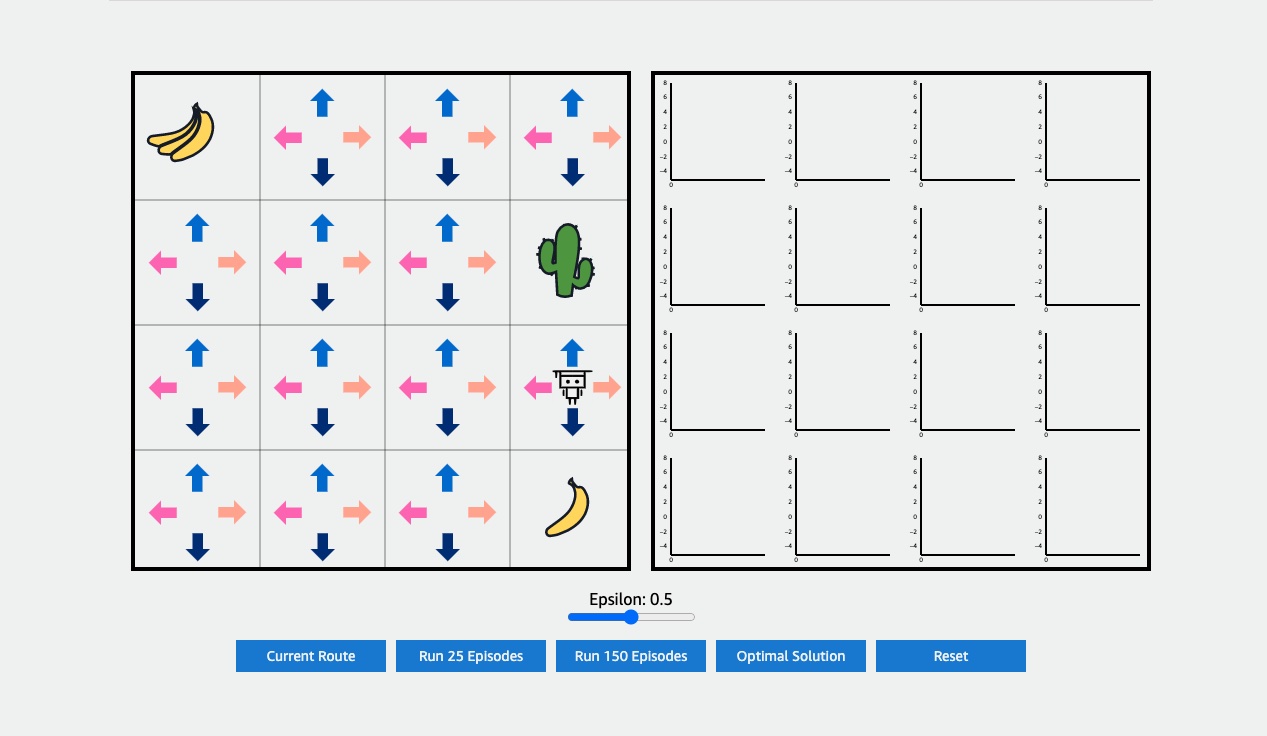
Learn about Reinforcement Learning (RL) and the exploration-exploitation dilemma with this interactive article.
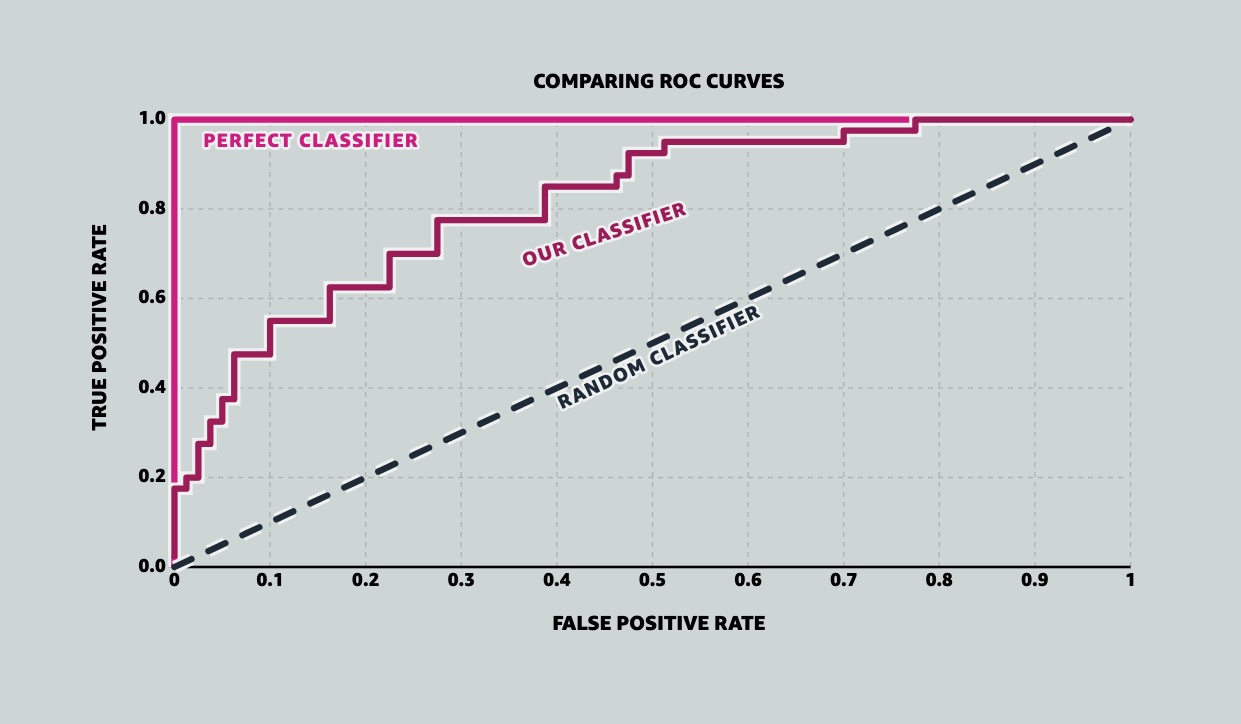
A visual explanation of the Receiver Operating Characteristic Curve (ROC) curve, how it works with a live interactive example, and how it relates to Area Under The Curve (AUC).
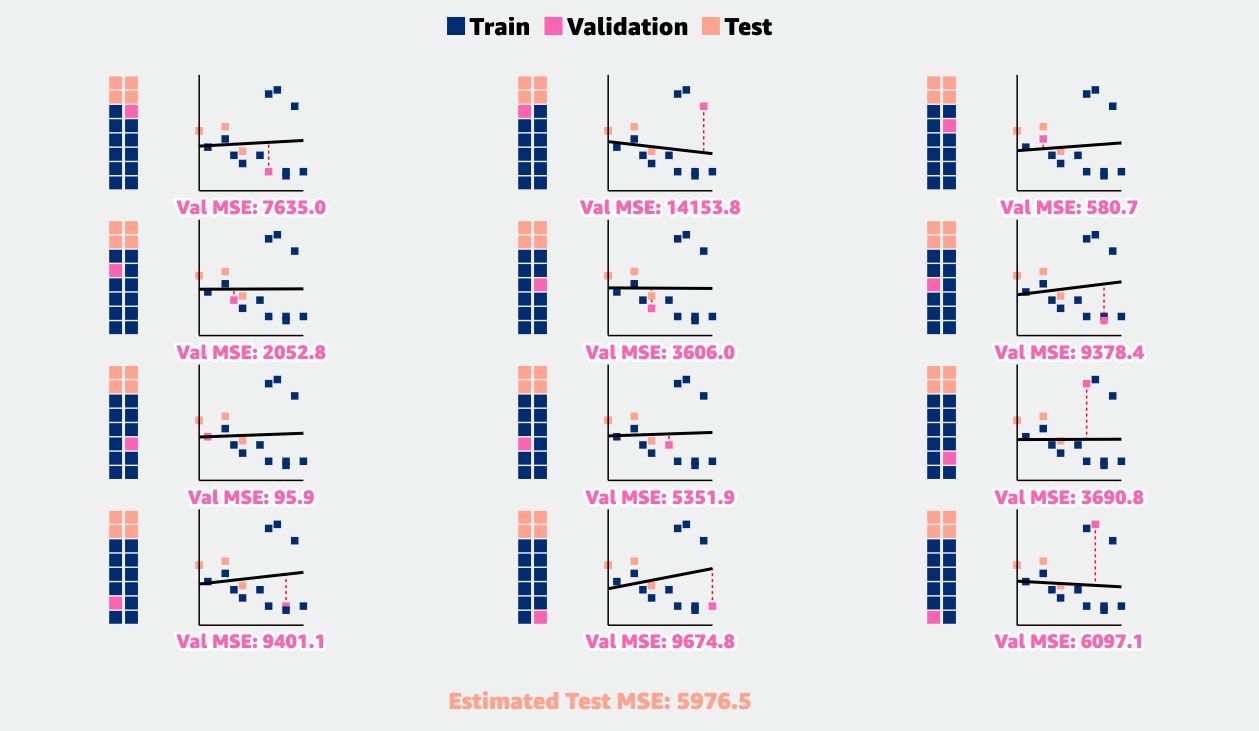
K-Fold Cross-Validation: a resampling technique to help improve estimates of test error rates compared to a simple validation set.
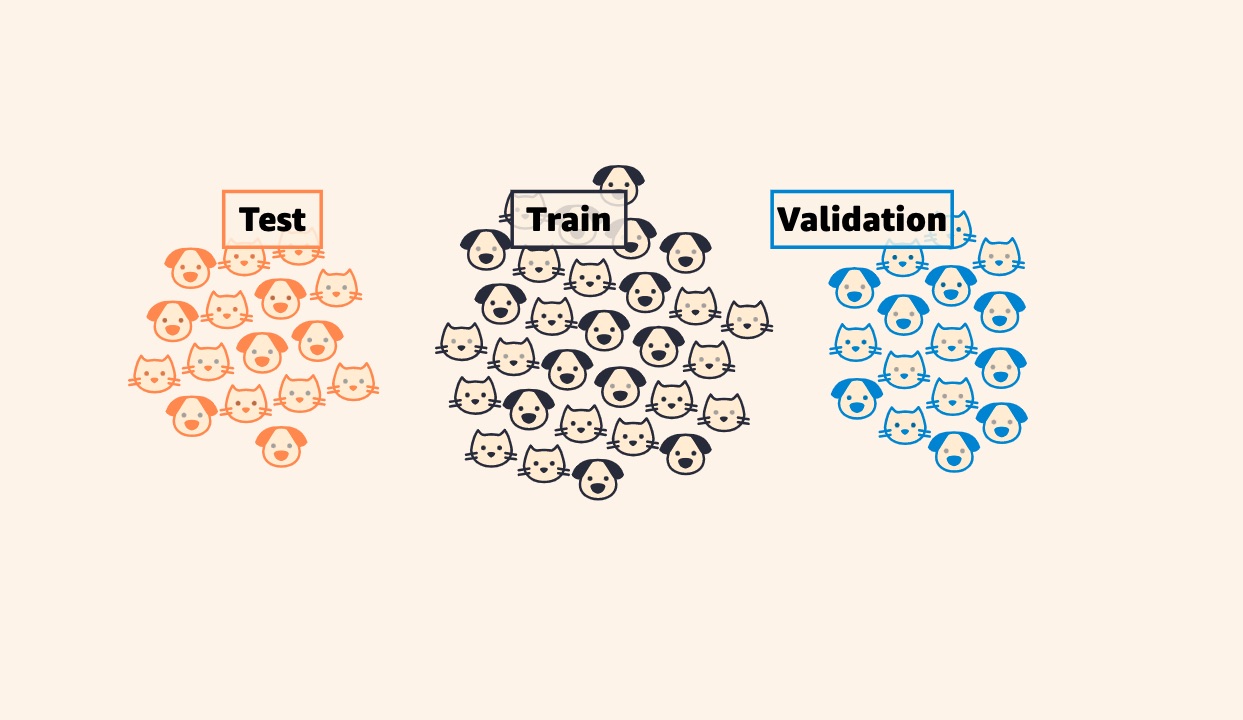
Learn why it is best practice to split your data into training, testing, and validation sets, and explore the utility of each with a live machine learning model.
When it comes to evaluating classification models, accuracy is often a poor metric. This article covers two common alternatives, Precision and Recall, as well as the F1-score and Confusion Matrices.
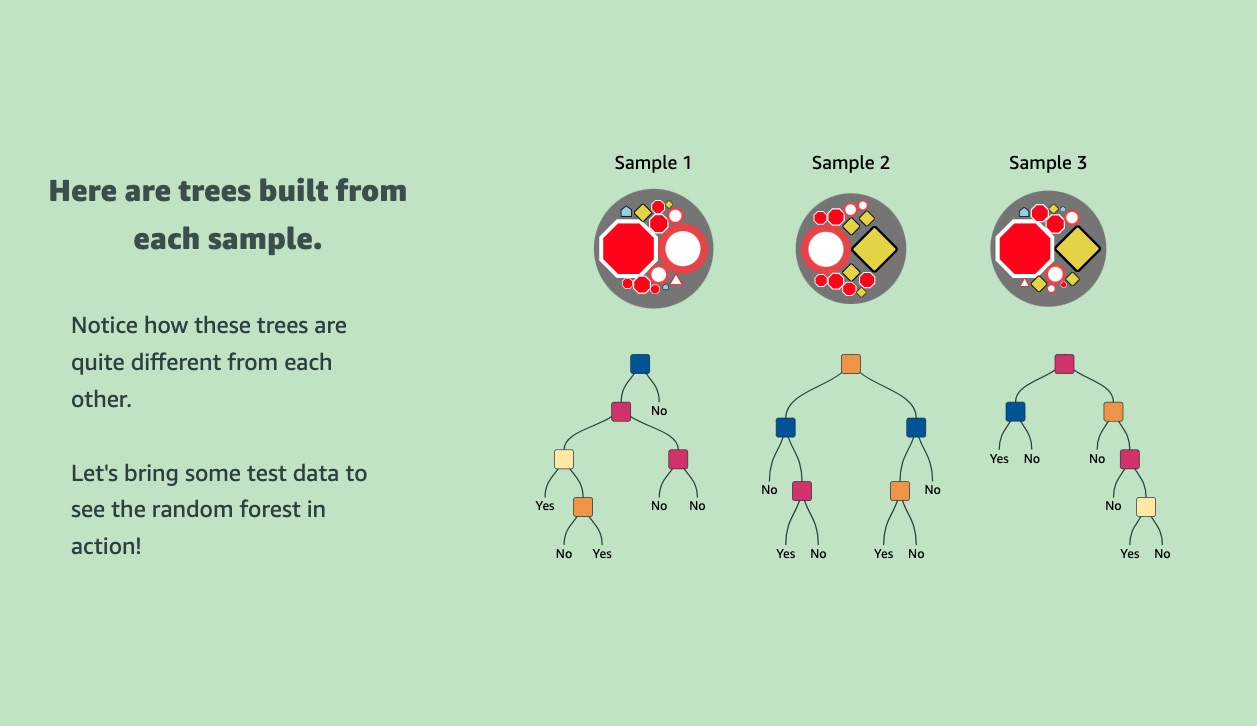
Learn how the majority vote and well-placed randomness can extend the decision tree model to one of machine learning's most widely-used algorithms, the Random Forest.
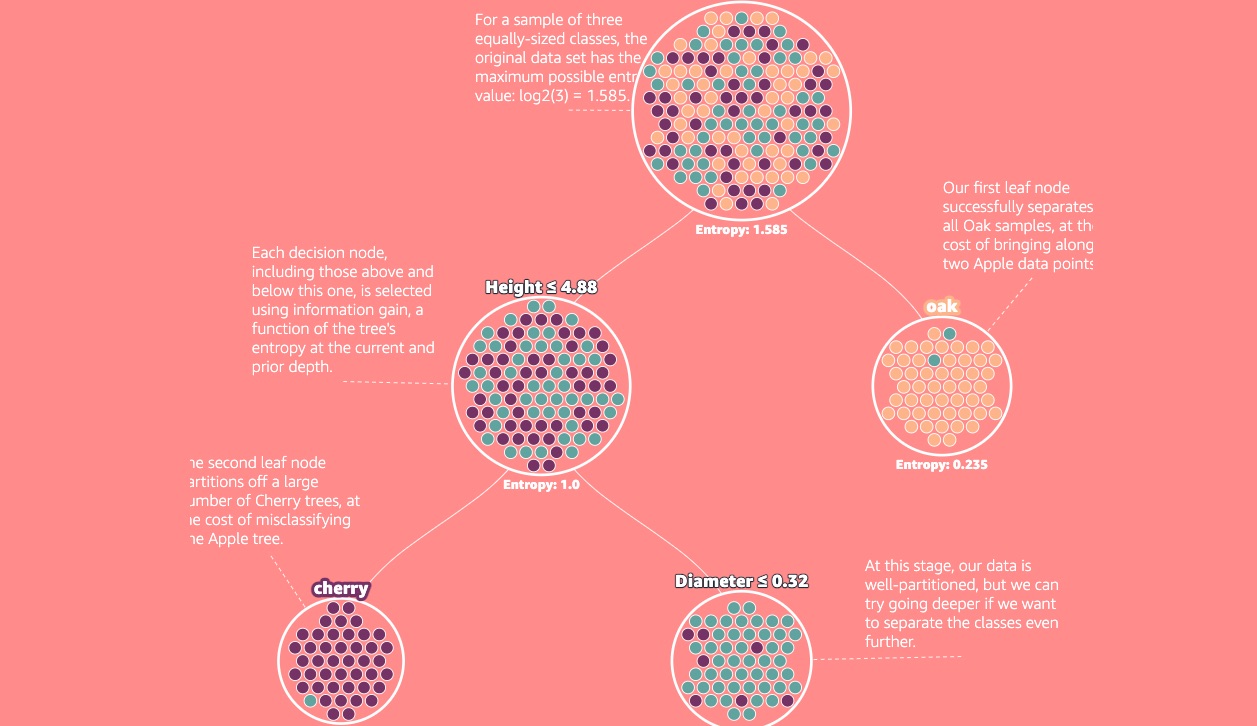
Explore one of machine learning's most popular supervised algorithms: the Decision Tree. Learn how the tree makes its splits, the concepts of Entropy and Information Gain, and why going too deep is problematic.

Understand the tradeoff between under- and over-fitting models, how it relates to bias and variance, and explore interactive examples related to LOESS and KNN.
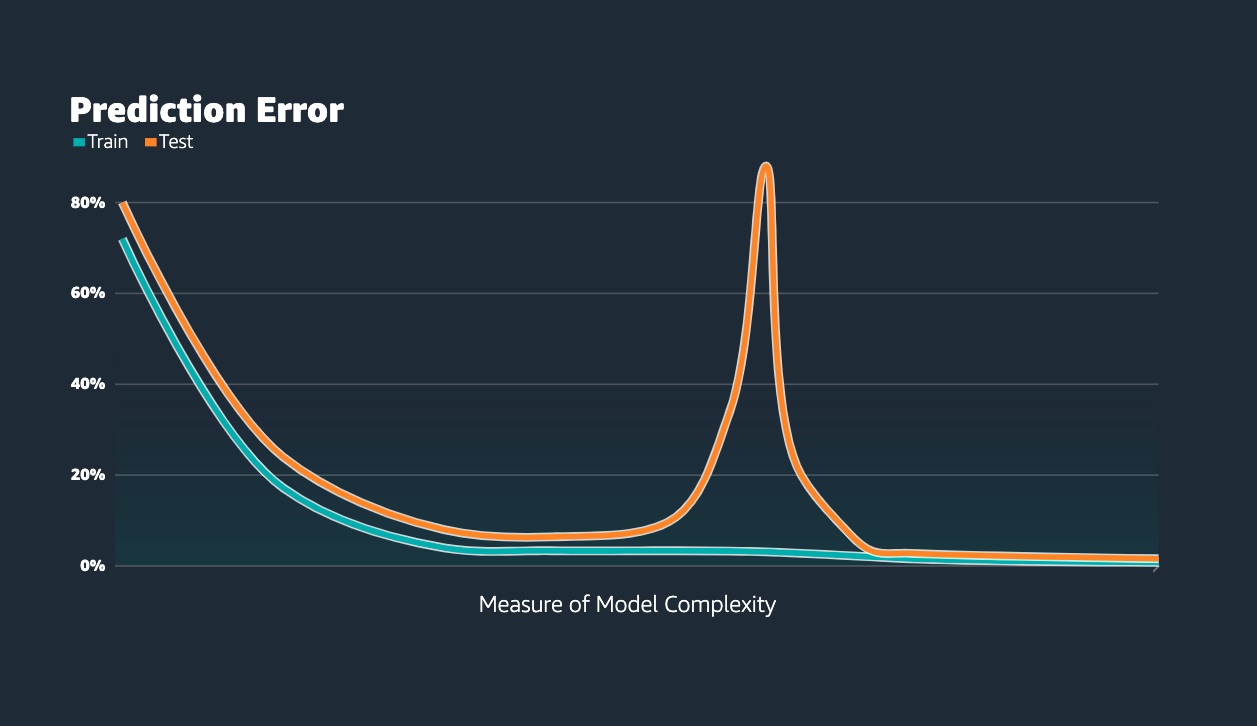
Meet the double descent phenomenon in modern machine learning: what it is, how it relates to the bias-variance tradeoff, the importance of the interpolation regime, and a theory of what lies behind.
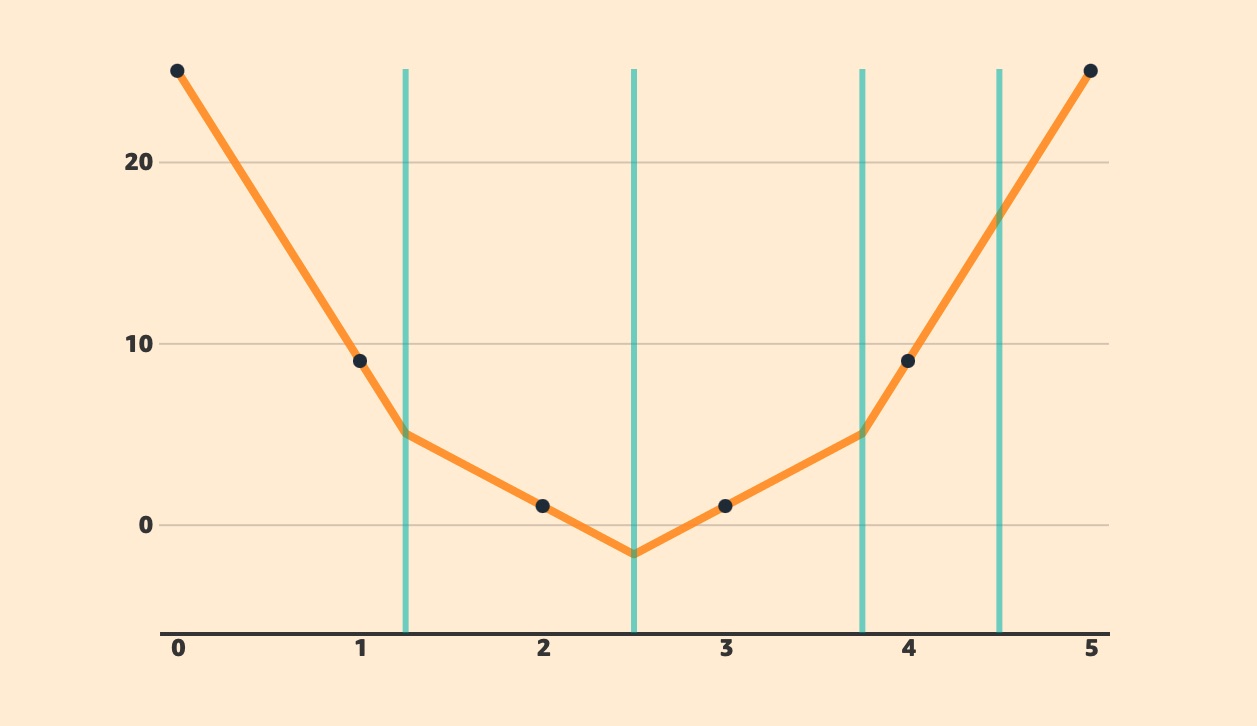
Deepen your understanding of the double descent phenomenon. The article builds on the cubic spline example introduced in Double Descent 1, describing in mathematical detail what is happening.